Chemical equilibrium is established when the rate of the forward reaction reaction equals the rate of the reverse reaction. Now what happens when this tranquility is disturbed?
In the previous article on chemical equilibrium (click here to be directed to that article), we told you that there are three factors that affect equilibrium:
- Concentration
- Pressure
- Temperature
In this article, are going to show graphically, the behaviour of chemical equilibrium and how it responds to a disturbance.
We are not including a catalyst as a factor but do keep in mind it affects the rate or reaction.
We used Le Chatelier's principle to explain how equilibrium respond to a disturbance.
- Le Chatelier’s principle:
- When a system at equilibrium is disturbed (by change in concentration, temperature or pressure), the system responds by opposing the change and a new equilibrium is established.
Now , let us begin with our work for equilibrium graphs. We will look at two types of graphs (click on any item to be directed to their section):
- Concentration vs. time
- 1.1. Concentration
- 1.2. Pressure
- 1.3. Temperature
- Rate vs. time
- 2.1. Concentration
- 2.2. Pressure
- 2.3. Temperature
- 2.3. Catalyst
Let's see how how the equilibrium graphs would look like for different disturbances.
1. Concentration vs. time
Everything about the concentration vs. time graph goes for the mole vs. time.
1.1. Concentration
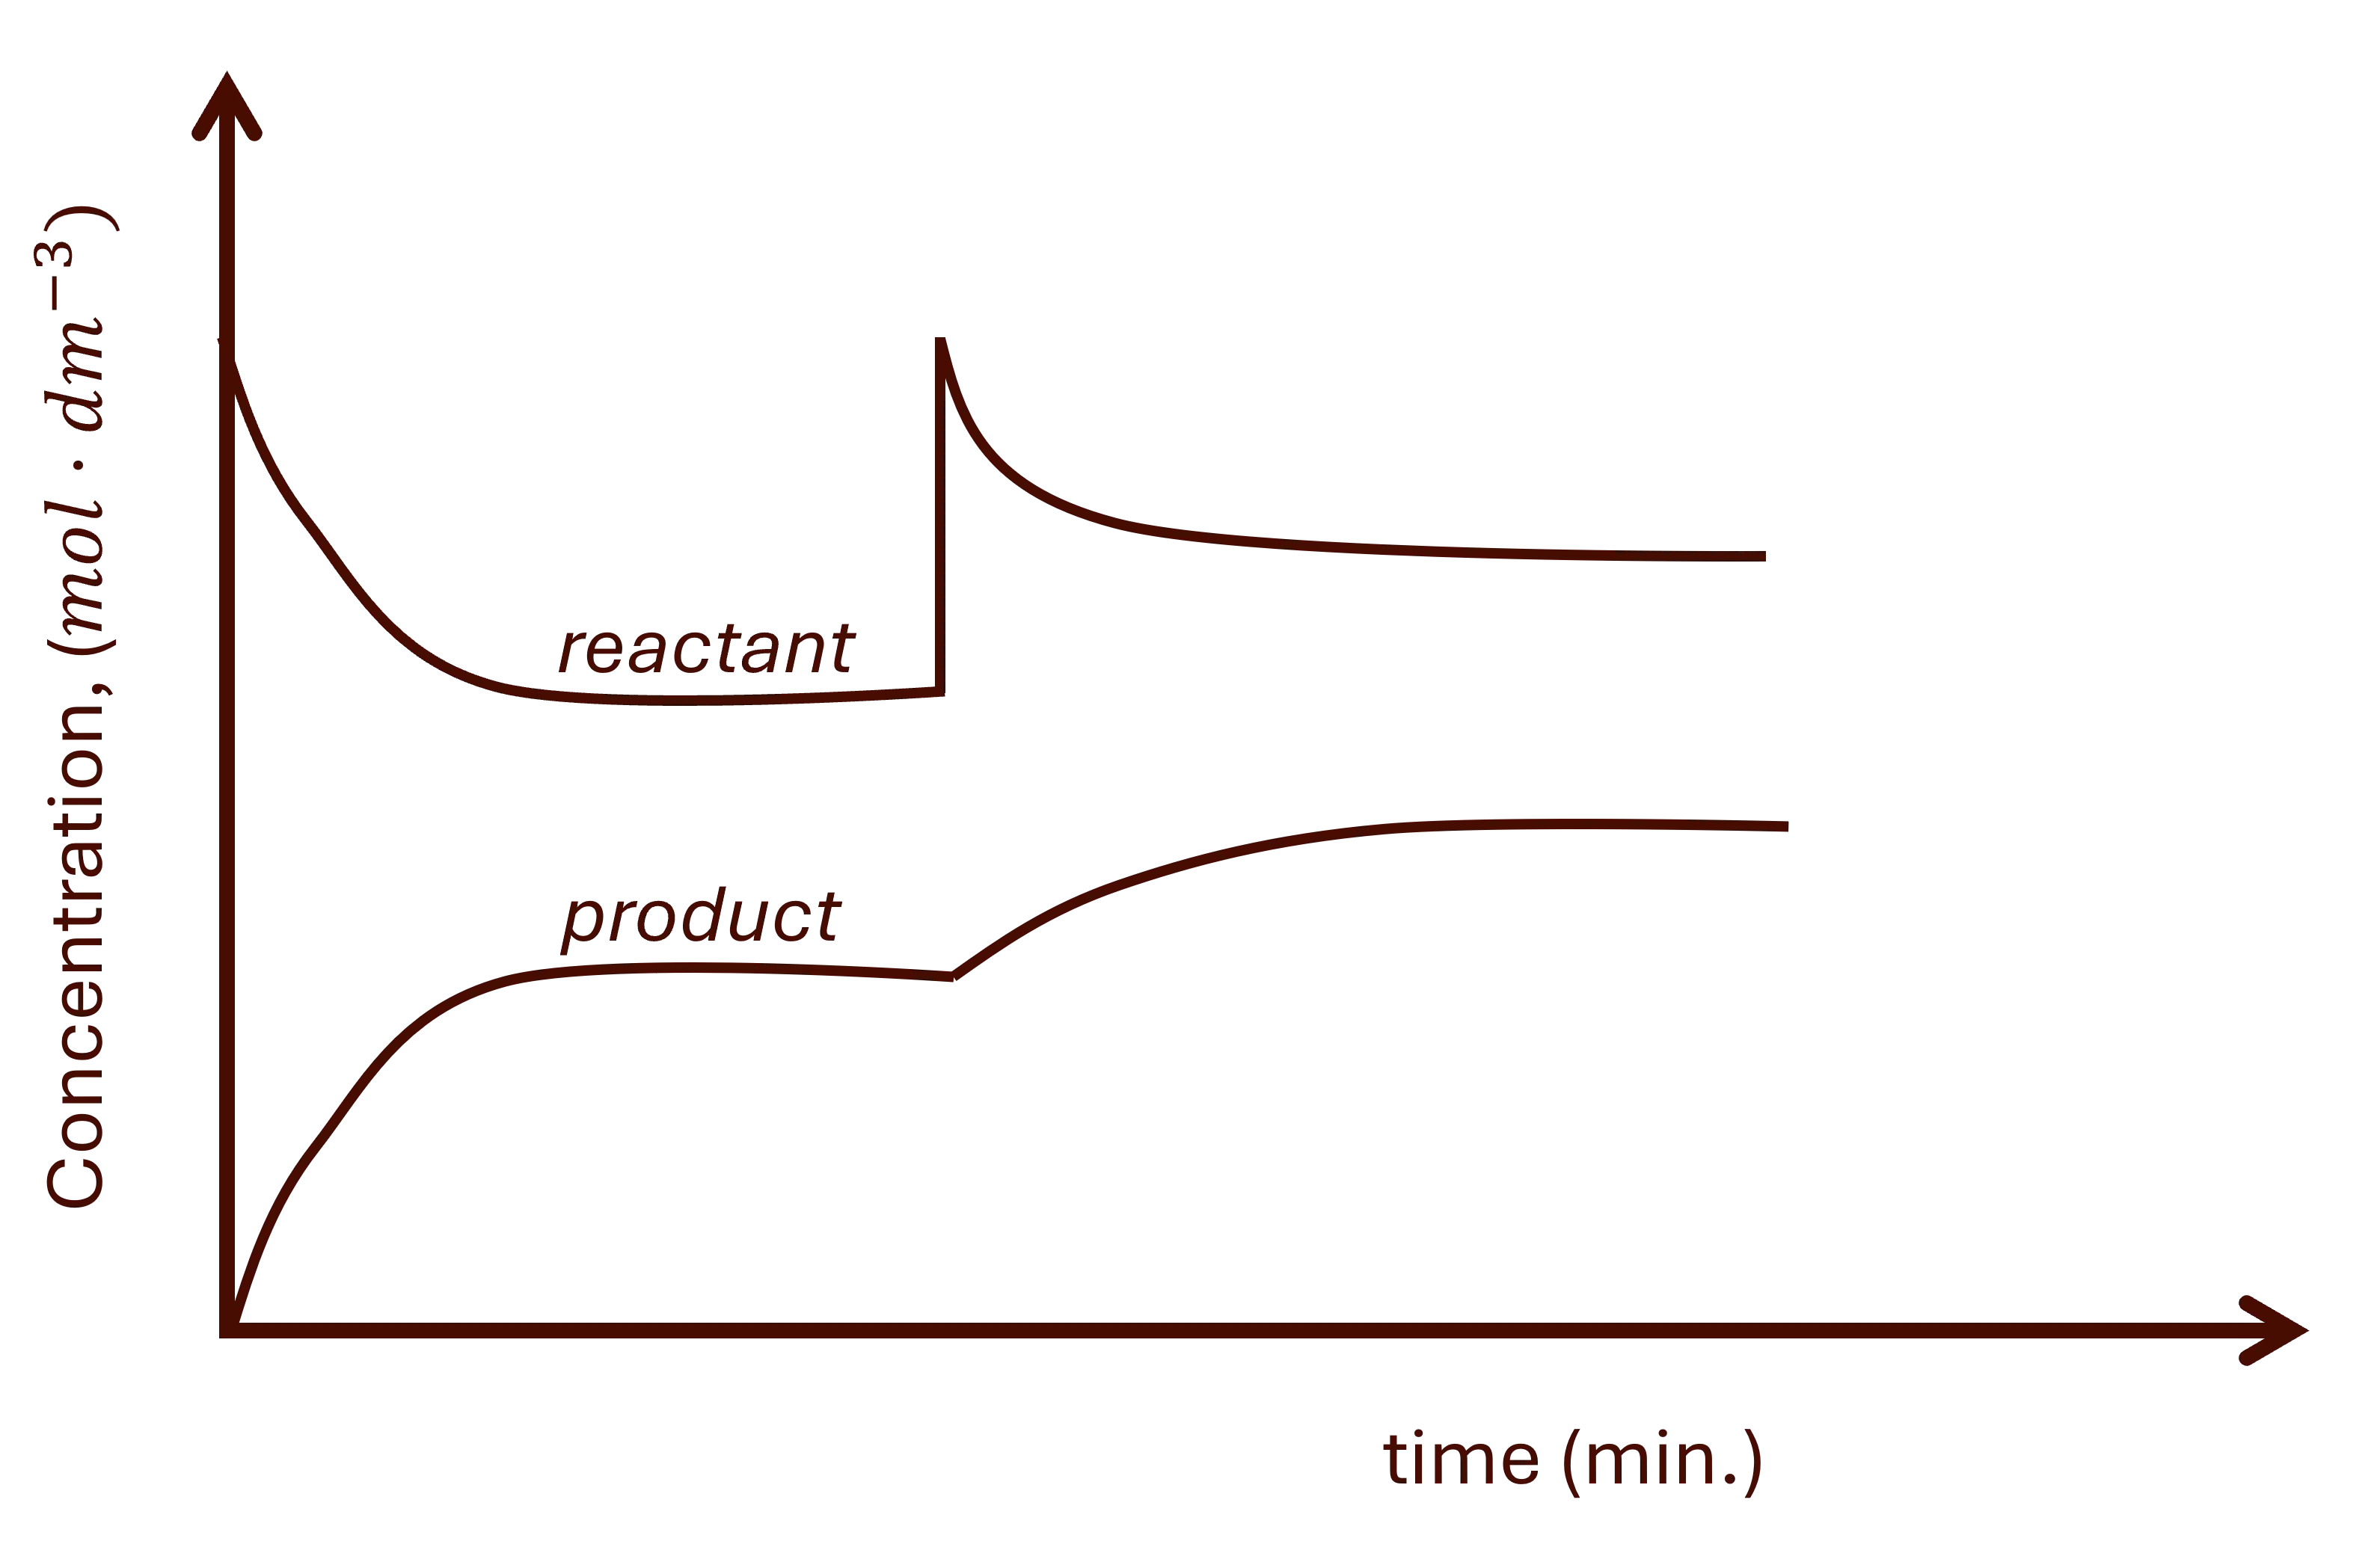
The disturbance can be seen as a sharp increase or decrease on the substance of interest followed by a gradual change in the opposite direction. See Fig1 1.
a. Changing reactant concentration
Increasing reactant concentration
- There is a sharp increase in the reactant. See Fig. 1.
- The system will react by decreasing this concentration, favouring the forward reaction.
- The following then happens:
- Gradual decrease of the reactant.
- Gradual increase of the product.
Decreasing reactant concentration
- There is a sharp decrease in the reactant.
- The system will react by increasing this concentration, favouring the reverse reaction.
- The following then happens:
- Gradual increase of the reactant.
- Gradual decrease of the product.
b. Changing product concentration
Increasing product concentration
- There is a sharp increase in the product.
- The system will react by decreasing the product concentration, favouring the reverse reaction.
- The following then happens:
- Gradual increase of the reactant.
- Gradual decrease of the product.
Decreasing product concentration
- There is a sharp decrease in the product.
- The system will react by increasing the product concentration, favouring the forward reaction.
- The following then happens:
- Gradual decrease of the reactant.
- Gradual increase of the product.
1.2. Pressure
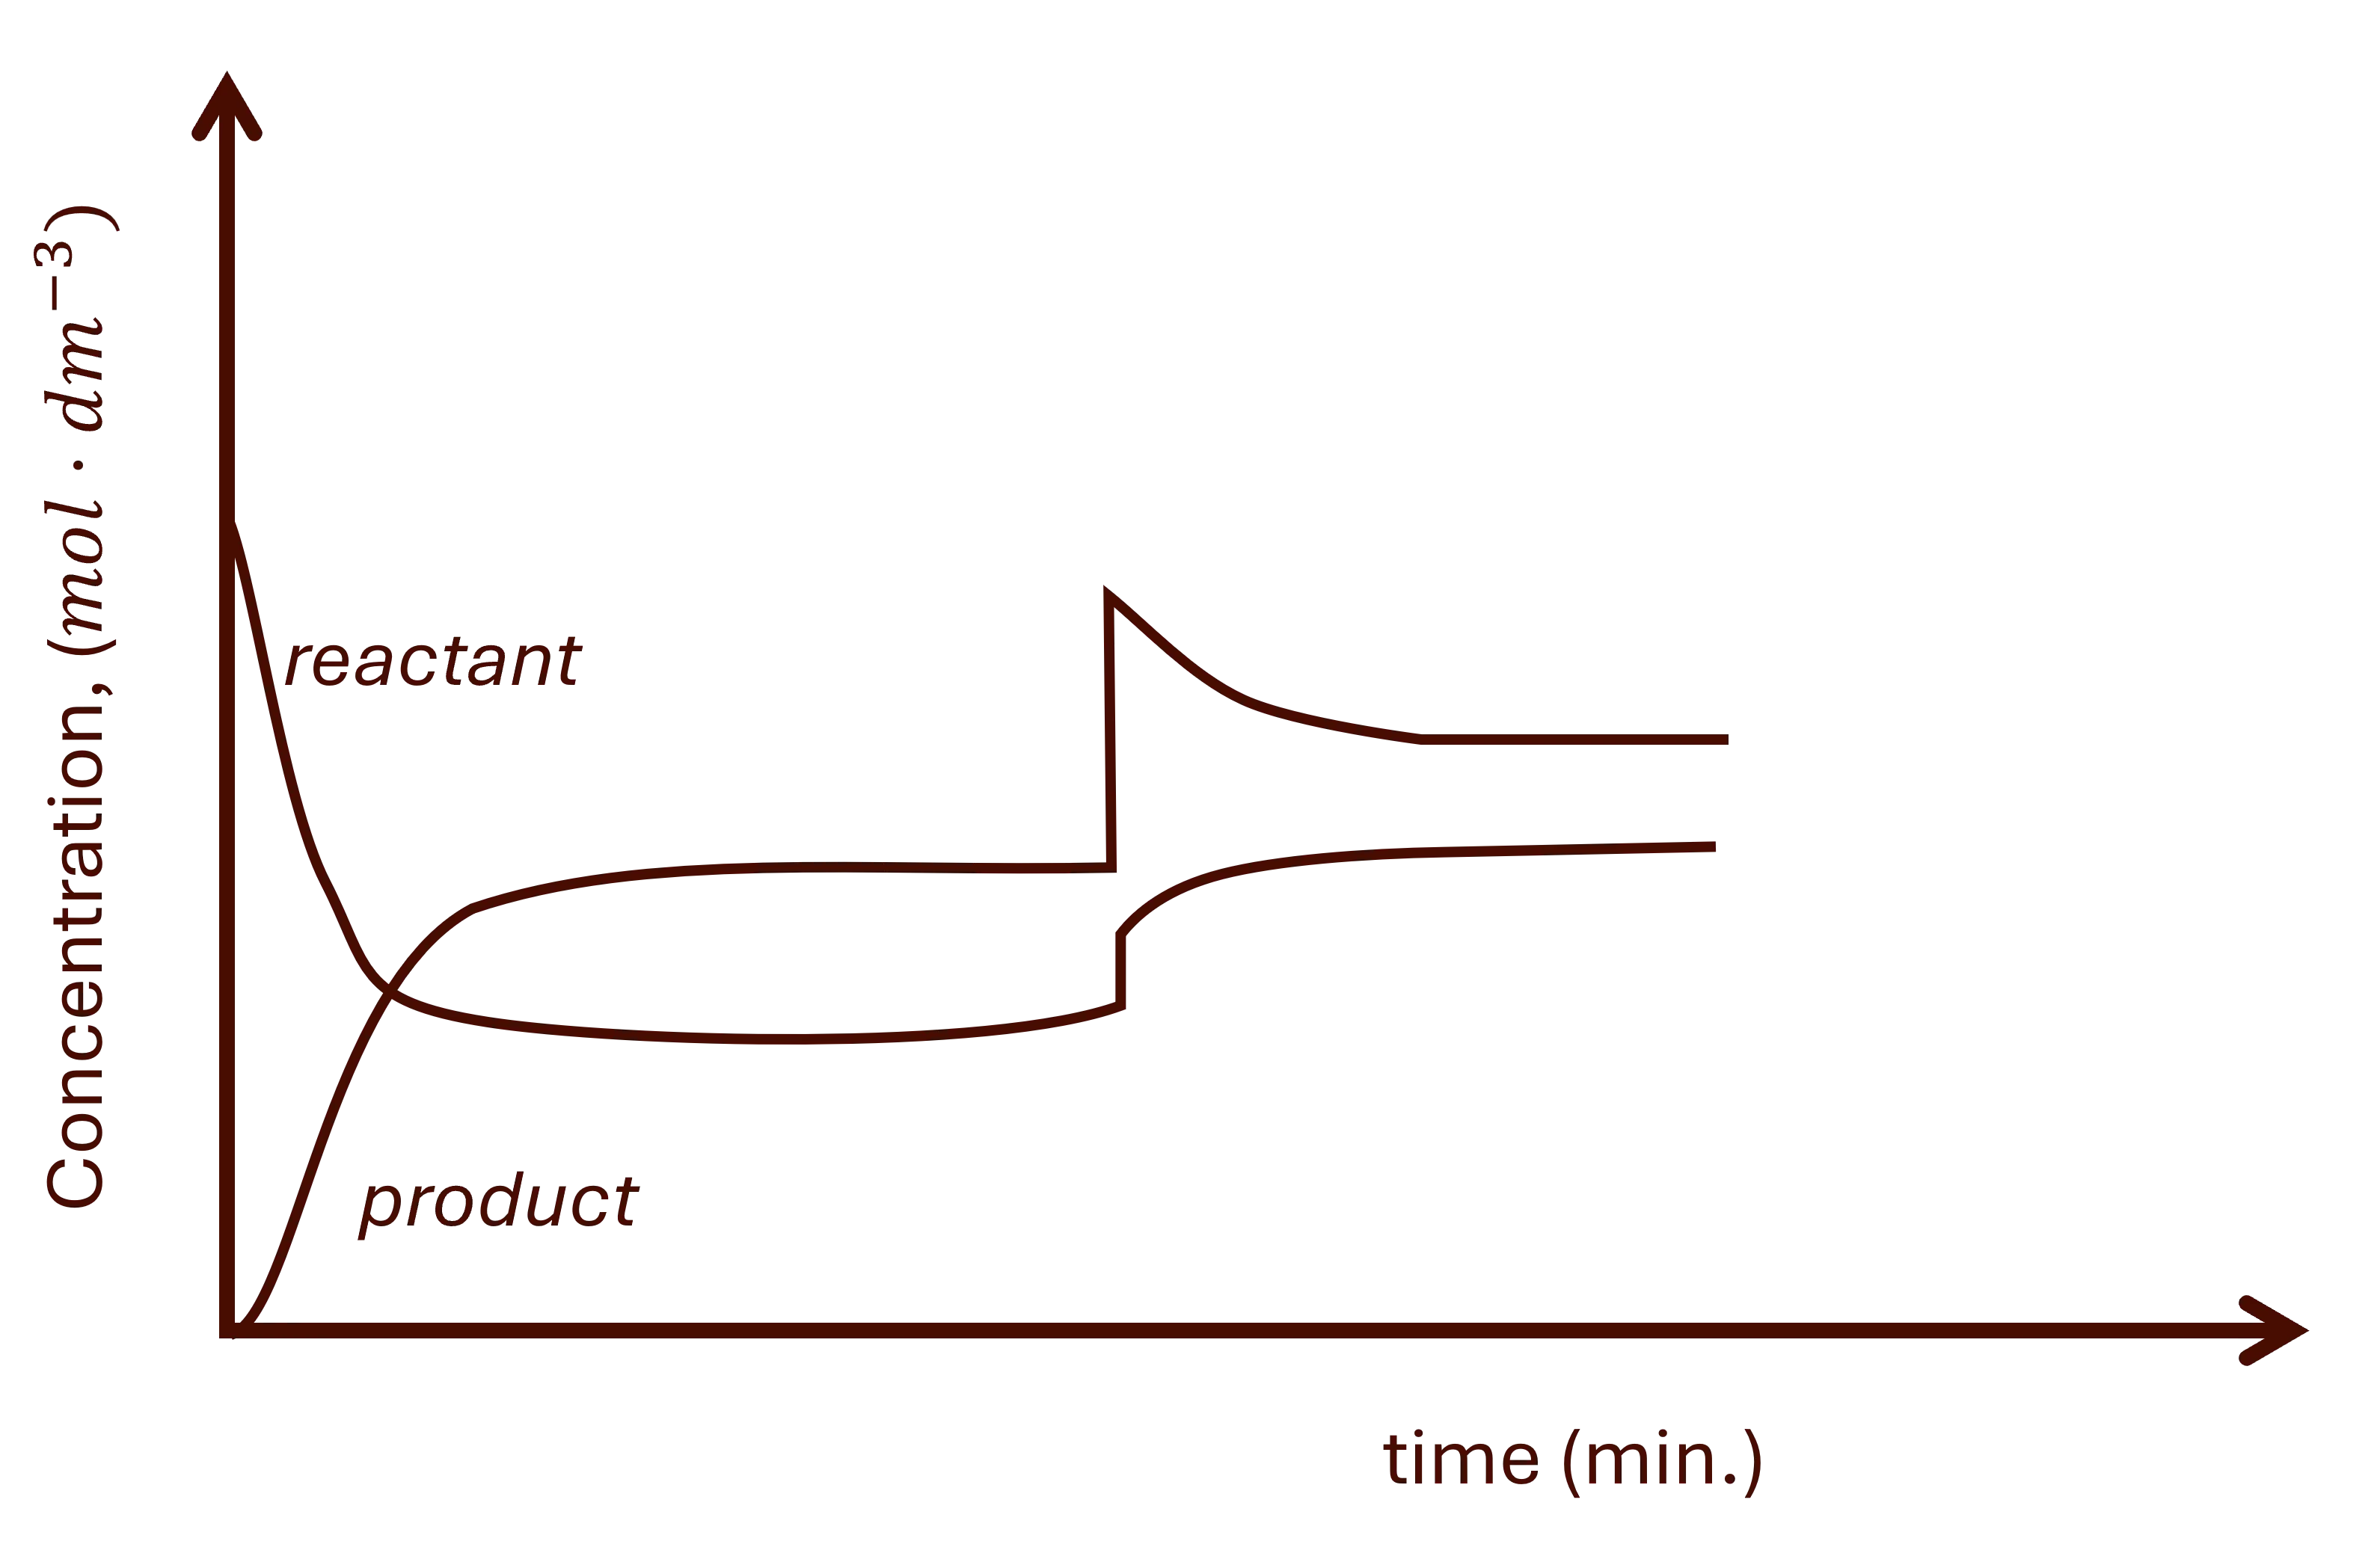
For a pressure change, there is a sharp unequal change in all gaseous reactants and products. This is then followed by a gradual increase or decrease depending on the reaction that is favoured. See Fig. 2, for example.
a. Increasing pressure
Increasing pressure favours the side with the least moles of gas.
Product moles of gas fewer than reactants'.
The results are seen in Fig. 2 above.
- There is a sharp increase in all gaseous reactants and products. The reactants' concentration will be the dominating.
- The system will react by decreasing the pressure of the system, favouring the side with fewer moles of gas.
- The products' side has fewer moles of gas, therefore, forward reaction is favoured.
- The following then happens:
- Gradual decrease of the reactant.
- Gradual increase of the product.
Product moles of gas greater than reactant's.
- There is a sharp increase in all gaseous reactants and products. The products' concentration will be the dominating.
- The system will react by decreasing the pressure of the system, favouring the side with fewer moles of gas.
- The reactants' side has fewer moles of gas, therefore, reverse reaction is favoured.
- The following then happens:
- Gradual increase of the reactant.
- Gradual decrease of the product.
b. Decreasing pressure
Decreasing pressure favours the side with the the most moles of gas.
Product moles of gas fewer than reactant's.
- There is a sharp increase in all gaseous reactants and products. The reactants' concentration will be dominating.
- The system will react by increasing the pressure of the system, favouring the side with the most moles of gas.
- The reactants' side has the most moles of gas, therefore, reverse reaction is favoured.
- The following then happens:
- Gradual increase of the reactant.
- Gradual decrease of the product.
Product moles of gas greater than reactant's.
- There is a sharp increase in all gaseous reactants and products. The products' concentration will be dominating.
- The system will react by increasing the pressure of the system, favouring the side with the most moles of gas.
- The products' side has the most moles of gas, therefore, forward reaction is favoured.
- The following then happens:
- Gradual decrease of the reactant.
- Gradual increase of the product.
1.3. Temperature
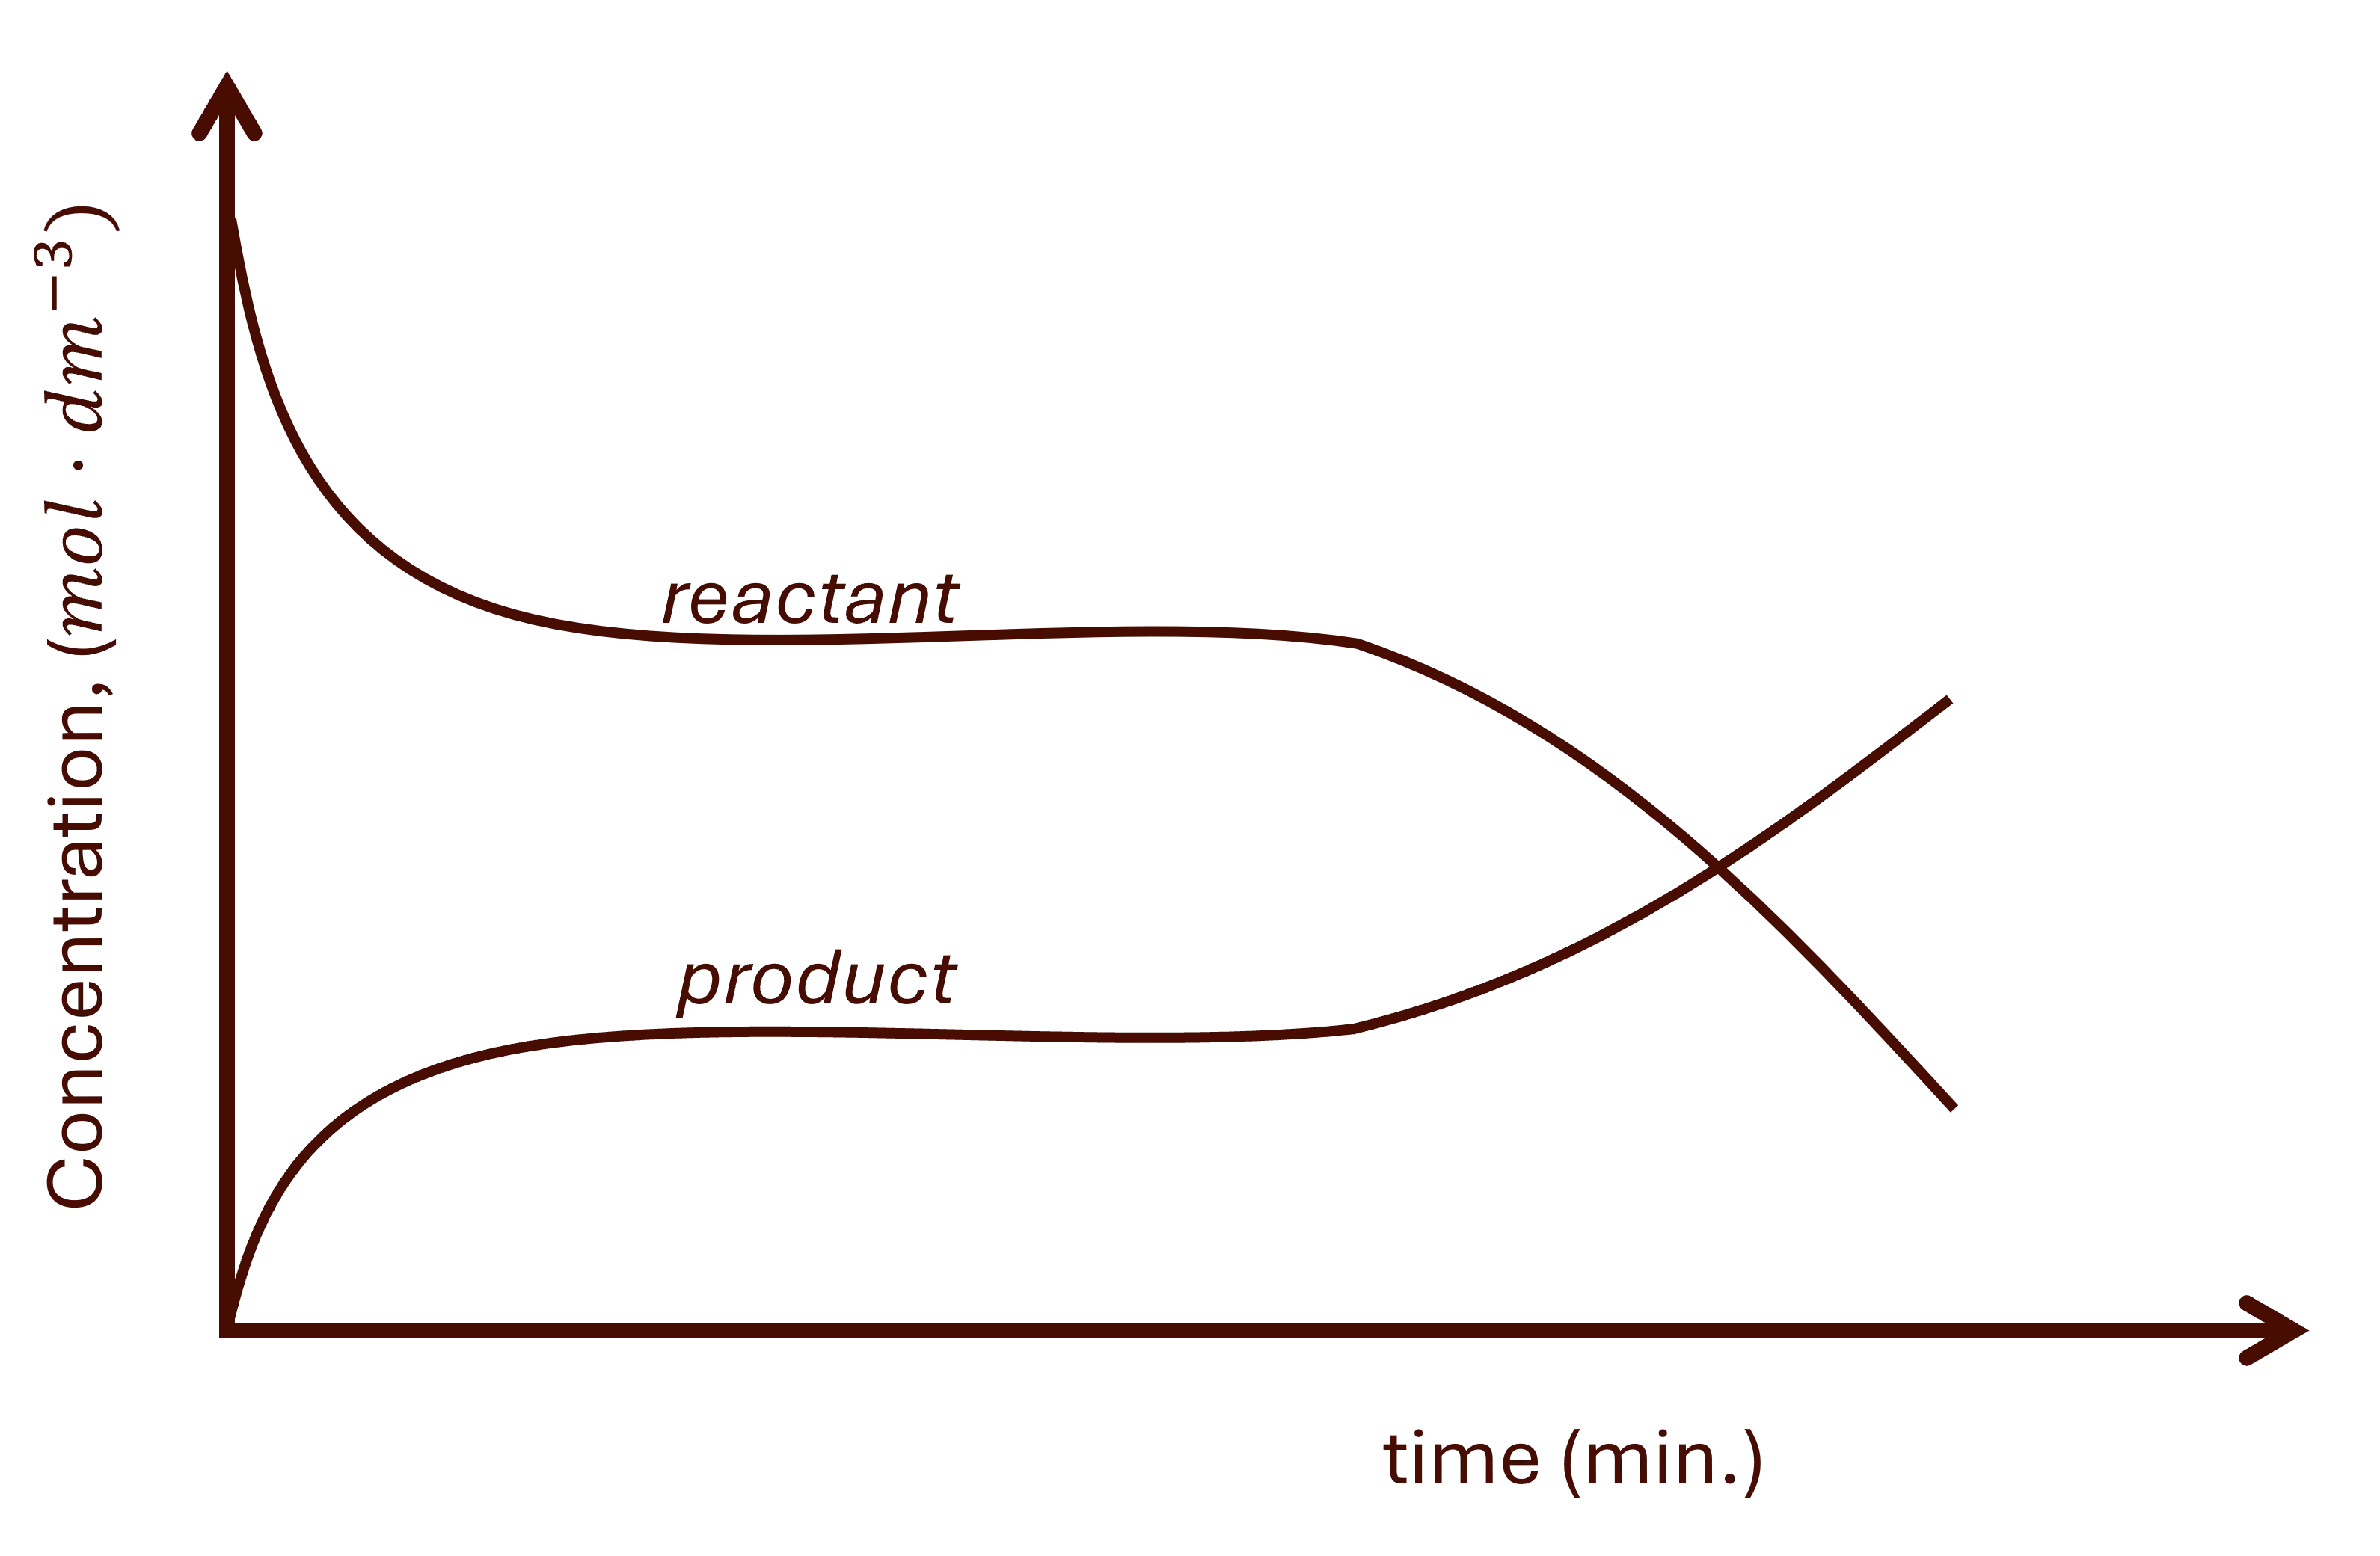
For the temperature change at equilibrium, there is a gradual change on all substances until the new equilibrium is established. See Fig. 3.
a. Increasing temperature.
The system will react by decreasing the temperature of the system. This favours the endothermic reaction.
Endothermic reaction.
The forward reaction is endothermic and the reverse is exothermic.
- The forward reaction is favoured.
- There is a gradual decrease in the reactants' concentration and gradual increase in the products' concentration until a new equilibrium is established. See Fig. 3 above.
Exothermic reaction.
The forward reaction is exothermic and the reverse is endothermic
- The reverse reaction is favoured.
- There is a gradual increase in the reactants' concentration and gradual decrease in the products' concentration until a new equilibrium is established.
b. Decreasing temperature
The system will react by increasing the temperature of the system. This favours the exothermic reaction.
Endothermic reaction.
The forward reaction is endothermic and the reverse is exothermic.
- The reverse reaction is favoured.
- There is a gradual increase in the reactants' concentration and gradual decrease in the products' concentration until a new equilibrium is established.
Exothermic reaction.
The forward reaction is exothermic and the reverse is endothermic.
- The forward reaction is favoured.
- There is a gradual decrease in the reactants' concentration and gradual increase in the products' concentration until a new equilibrium is established.
2. Rate vs. time
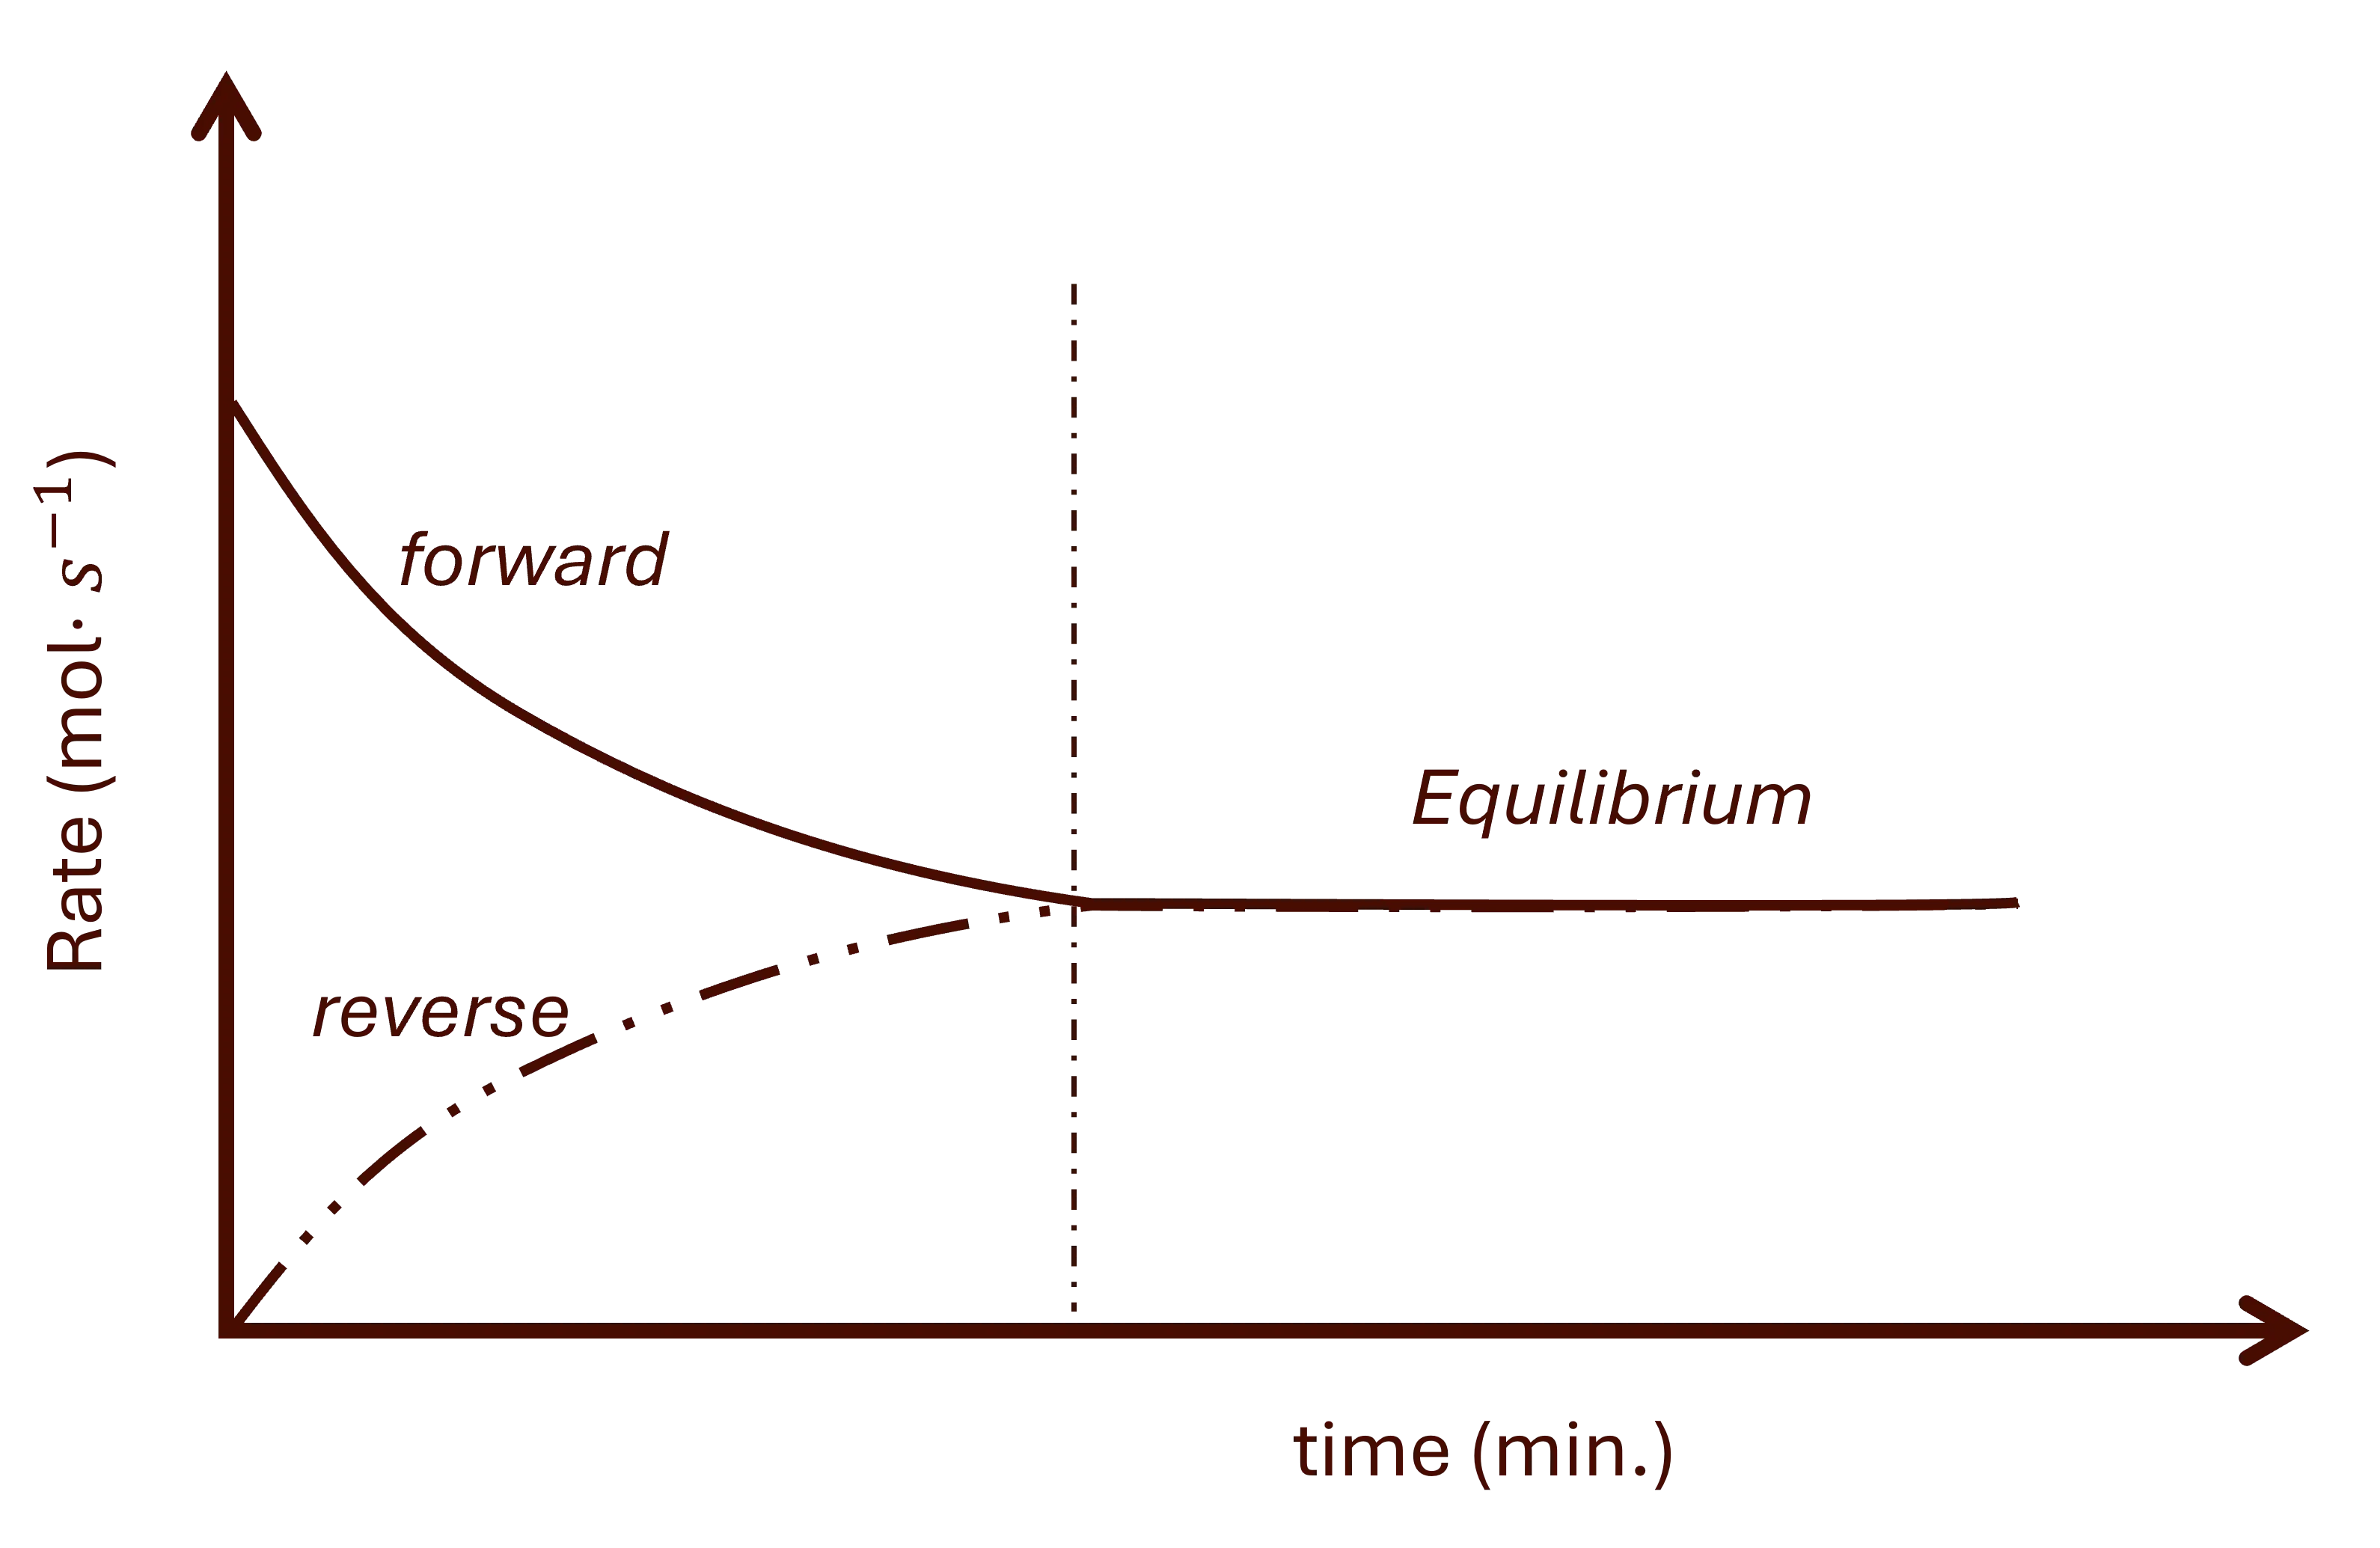
In interpreting the rate vs time graphs like the one in Fig. 4, it is important note the following:
- If concentration of reactants is steadily decreasing and that of products is steadily increasing, then the forward reaction is using reactants faster than the reverse reaction is using the products. Therefore, the forward reaction is faster than the reverse reaction.
- If concentration of reactants is steadily increasing and that of products is steadily decreasing, then the forward reaction must be using reactants slower than the reverse reaction is using the products. Therefore, the forward reaction is slower than the reverse reaction.
Now let's look at our graphs.
2.1. Concentration

A change in concentration will be seen with a sharp increase or decrease on the reaction of interest reaction.
a. Changing reactant concentration
Increasing reactant concentration
- There is a sharp increase on the forward reaction. See Fig. 5 above.
- The following then happens:
- Gradual decrease of the forward reaction.
- Gradual increase of the reverse reaction.
- The new equilibrium will be higher than the first.
Decreasing reactant concentration
- There is a sharp decrease on the forward reaction.
- The following then happens:
- Gradual increase of the forward reaction.
- Gradual increase of the reverse reaction.
- The new equilibrium will be lower than the first.
b. Changing product concentration
Increasing product concentration
- There is a sharp increase on the reverse reaction.
- The following then happens:
- Gradual decrease of the reverse reaction.
- Gradual increase of the forward reaction.
- The new equilibrium will be lower than the first.
Decreasing product concentration
- There is a sharp decrease on the reverse reaction.
- The following then happens:
- Gradual increase of the reverse reaction.
- Gradual decrease of the forward reaction.
- The new equilibrium will be higher than the first.
2.2. Pressure
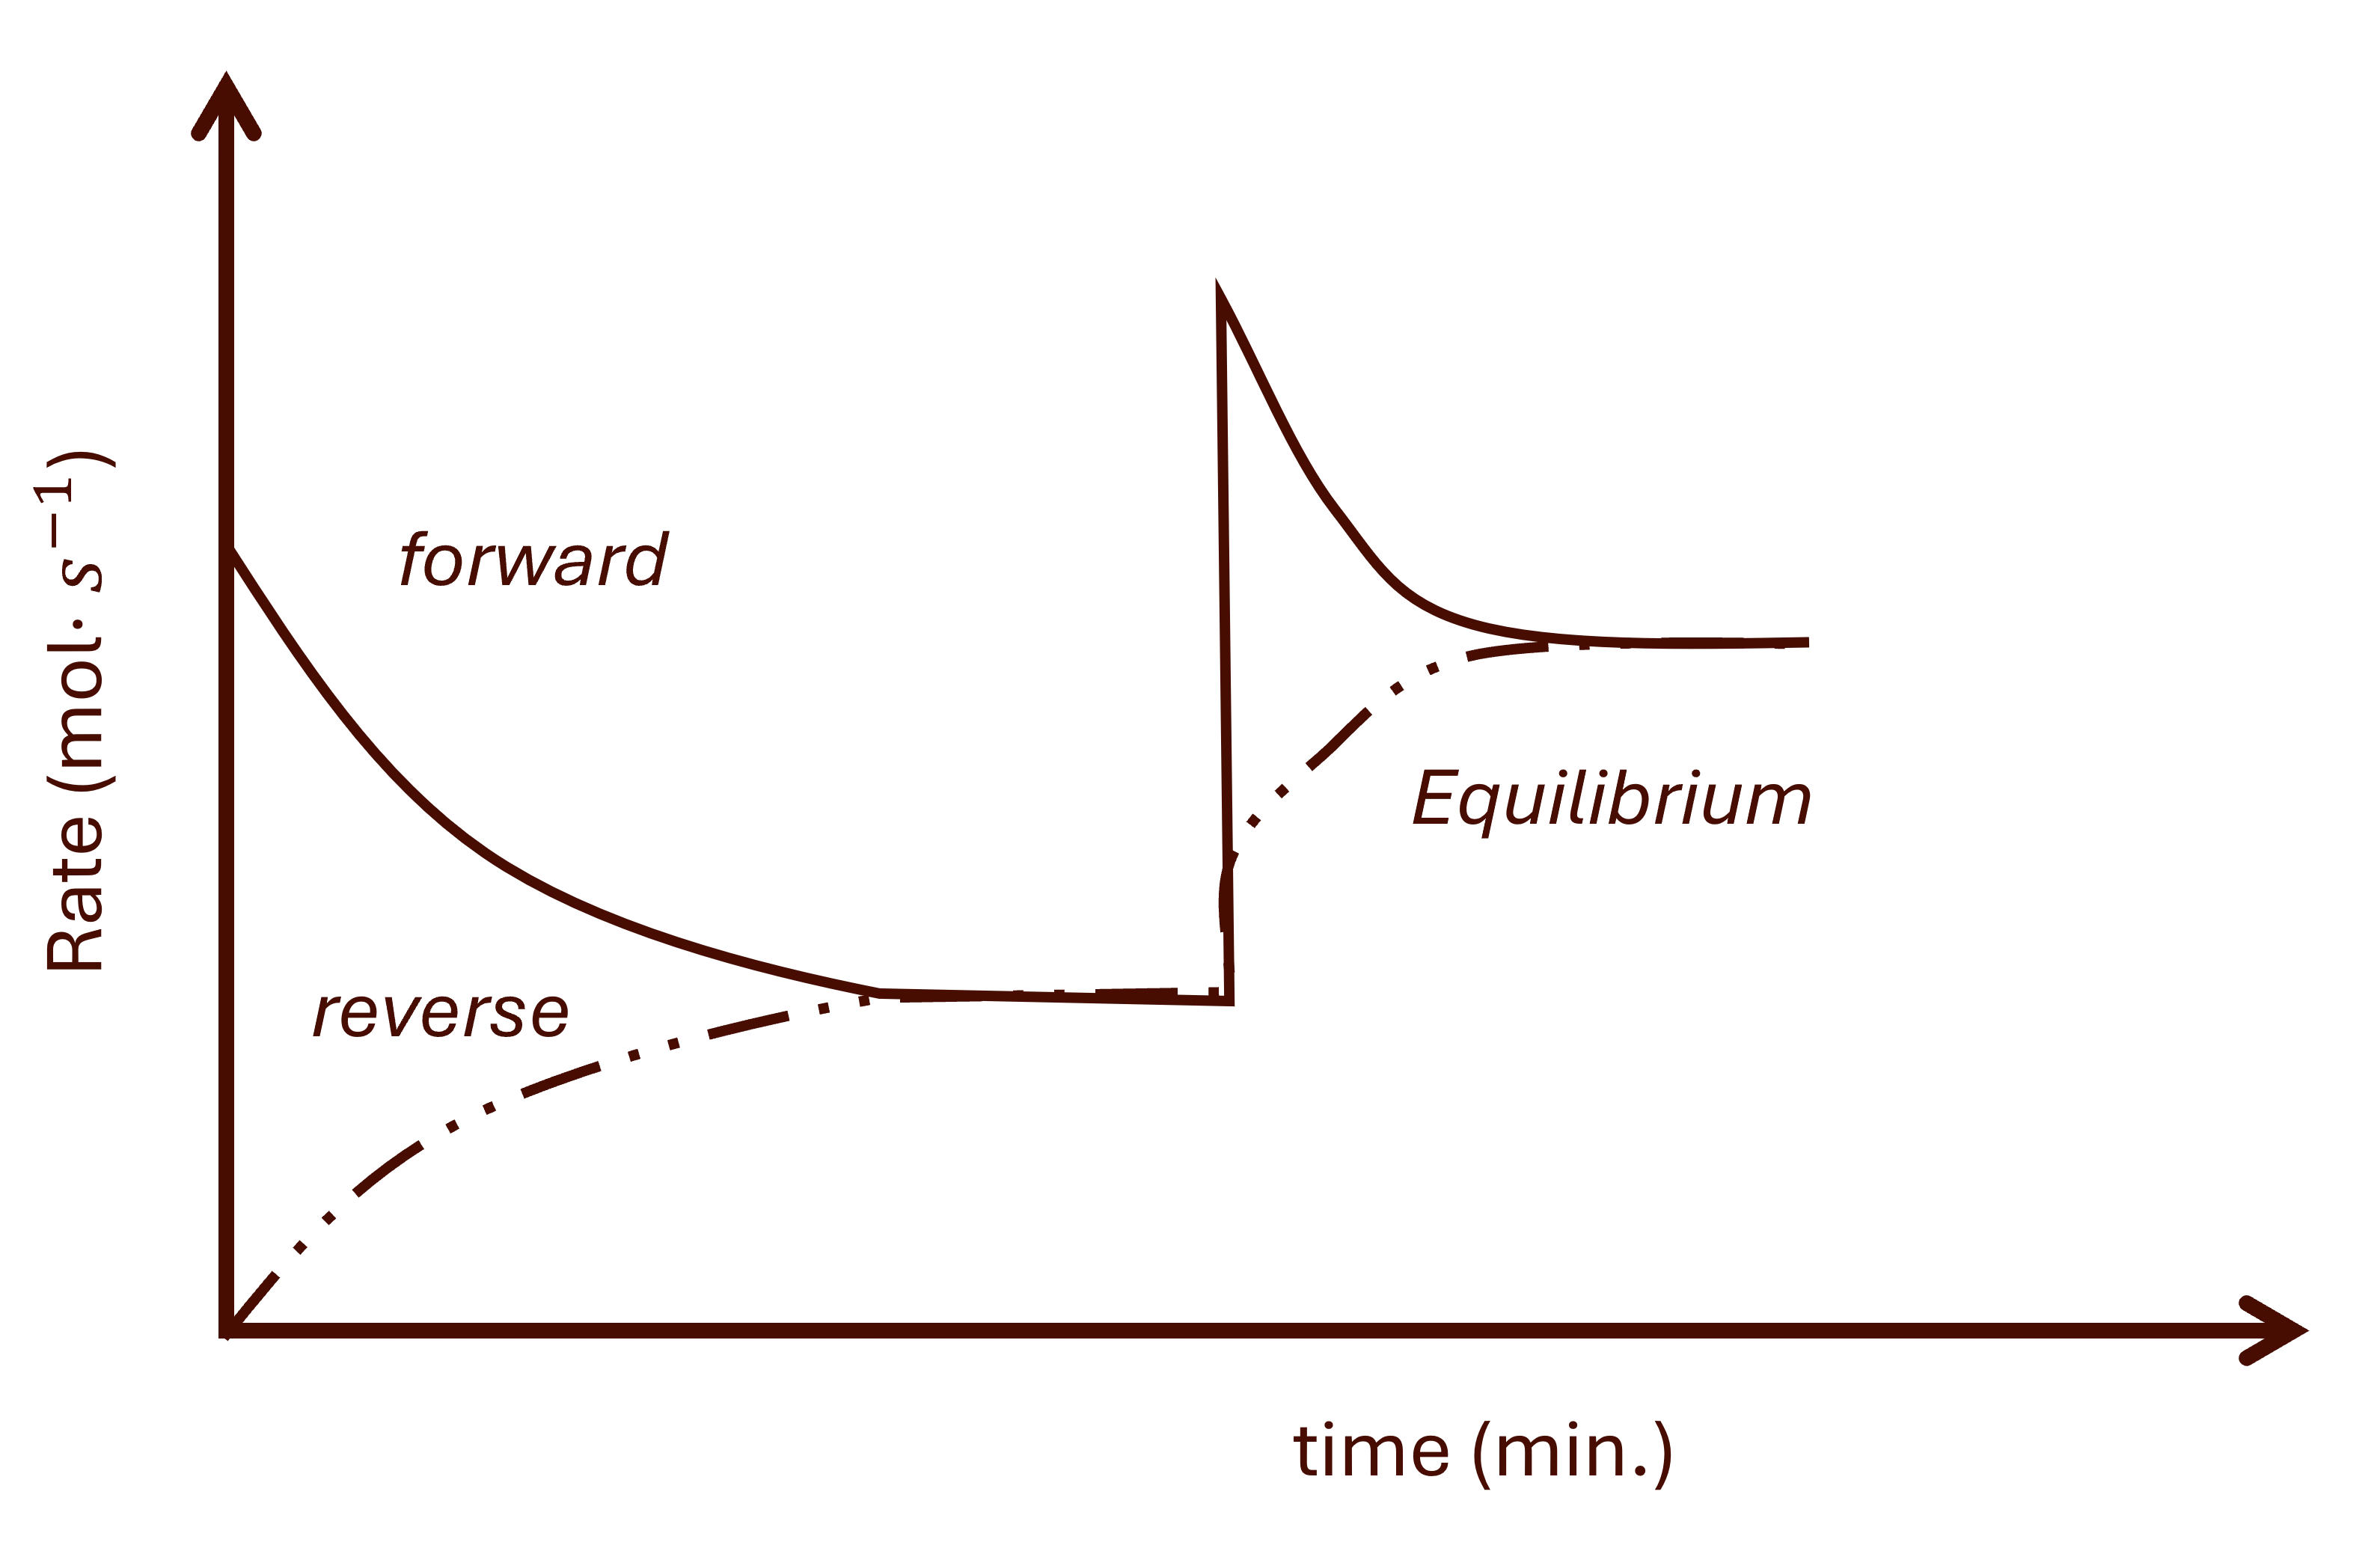
This effect can only happen if the systems at equilibrium are gaseous. Pressure effect on rate vs time will be observed with a sharp increase or decrease in both reactions.See for Fig. 6.
a. Increasing pressure
Increasing pressure favours the side with the least moles of gas, i.e., the reaction that reduces the pressure. Generally, for increasing presure, the following will be observed:
- Sharp increase in both reactions.
- Favoured reaction will be sharper (dominating).
- Then the following will happen:
- The favoured reaction will decrease gradually.
- The other reaction will increase gradually
Let us now break it down some more.
Product moles of gas fewer than reactants'.
The results are seen in Fig. 6 above.
- There is a sharp increase in all reactions.
- The system will react by decreasing the pressure of the system, favouring the side with fewer moles of gas.
- The products' side has fewer moles of gas, therefore, forward reaction is favoured.
- The forward reaction dominates (it is longer).
- The following then happens:
- Gradual decrease of the forward reaction.
- Gradual increase of the reverse.
- The new equilibrium will be higher than the first.
Product moles of gas greater than reactants'.
- There is a sharp increase in all reactions.
- The system will react by decreasing the pressure of the system, favouring the side with fewer moles of gas.
- The reactants' side has fewer moles of gas, therefore, reverse reaction is favoured.
- The reverse reaction dominates (it is longer).
- The following then happens:
- Gradual decrease of the reverse reaction.
- Gradual increase of the forward reaction.
- The new equilibrium will be higher than the first.
b. Decreasing pressure
Decreasing pressure favours the side with the most moles of gas, i.e., the reaction that increases the pressure. Generally, for decreasing presure, the following will be observed:
- Sharp decrease in both reactions.
- Favoured reaction will be less sharp (will be short).
- Then the following will happen:
- The favoured reaction will decrease gradually.
- The other reaction will increase gradually.
Let us now break it down some more.
Product moles of gas fewer than reactants'.
- There is a sharp decrease in all reactions.
- The system will react by increasing the pressure of the system, favouring the side with the most moles of gas.
- The reactants' side has the most moles of gas, therefore, the reverse reaction is favoured.
- The reverse reaction will be less dominating (it is shorter).
- The following then happens:
- Gradual decrease of the reverse forward.
- Gradual increase of the forward reaction.
- The new equilibrium will be lower than the first.
Product moles of gas greater than reactants'.
- There is a sharp decrease in all reactions.
- The system will react by increasing the pressure of the system, favouring the side with the most moles of gas.
- The products' side has the most moles of gas, therefore, the forward reaction is favoured.
- The forward reaction will be less dominating (it is shorter).
- The following then happens:
- Gradual decrease of the forward reaction.
- Gradual increase of the reverse forward.
- The new equilibrium will be lower than the first.
2.3. Temperature
For the temperature change at equilibrium for the rate vs. time, there is a sharp change in both reactions until the new equilibrium is established. The graph is the same as the pressure effect in Fig. 6.
a. Increasing temperature.
The system will react by decreasing the temperature of the system. This favours the endothermic reaction.
Endothermic reaction.
There is sharp increase in all reactions
The forward reaction is endothermic and the reverse is exothermic.
- The forward reaction is favoured.
- The forward reaction dominates (it is longer).
- The following then happens:
- Gradual decrease of the forward reaction.
- Gradual increase of the reverse forward.
- The new equilibrium will be higher than the first.
- The new \(K_c\) is higher.
Exothermic reaction.
There is sharp increase in all reactions
The forward reaction is exothermic and the reverse is endothermic.
- The reverse reaction is favoured.
- The reverse reaction dominates (it is longer).
- The following then happens:
- Gradual decrease of the reverse forward.
- Gradual increase of the forward reaction.
- The new equilibrium will be higher than the first.
- The new \(K_c\) is lower.
b. Decreasing temperature.
The system will react by increasing the temperature of the system. This favours the exothermic reaction.
Endothermic reaction.
There is sharp decrease in all reactions.
The forward reaction is endothermic and the reverse is exothermic.
- The reverse reaction is favoured.
- The reverse reaction will be less dominating (it is shorter).
- The following then happens:
- Gradual decrease of the reverse forward.
- Gradual increase of the forward reaction.
- The new equilibrium will be lower than the first.
- The new \(K_c\) is lower.
Exothermic reaction.
There is sharp decrease in all reactions.
The forward reaction is endothermic and the reverse is exothermic.
- The forward reaction is favoured.
- The forward reaction will be less dominating (it is shorter).
- The following then happens:
- Gradual decrease of the forward reaction.
- Gradual increase of the reverse forward.
- The new equilibrium will be lower than the first.
- The new \(K_c\) is higher.
2.4. Catalyst

A catalyst speeds up the reaction rate. Its addition or removal favours the reactions in the same way. See Fig. 7.
Adding a catalyst
When a catalyst is added, both reactions (their reaction rates, of course) will increase sharply and at the time until a new, higher equilibrium is reached, Fig. 7
Removing a catalyst
When a catalyst is removed, both reactions will decrease sharply and at the time until a new, lower equilibrium is reached.